Surface-Directed Crystallisation
Synthesis and characterisation of amorphous calcium carbonate in nanopipettes
Morris P. D., McPherson I. J., Meloni G. M., and Unwin P. R., “Nanoscale kinetics of amorphous calcium carbonate precipitation in H2O and D2O,” Phys. Chem. Chem. Phys. 2020, 22 (38), 22107–22115 https://doi.org/10.1039/D0CP03032E
The formation of amorphous calcium carbonate (ACC) — an unstable precursor to the crystalline variant — was investigated with the use of nanopipettes in bath solution (see Figure 1, and the Phys. Chem. Chem. Phys. 2020 article). Pipette probes can be used to locally and controllably (here, via electrochemical control) mix materials, inside or near the orifice, at micrometre scales or smaller. In this work, carbonate ions from inside the pipette were mixed near the tip end with calcium ions from the bath, by applying an appropriate potential between the setup’s two electrodes (one in the pipette and one in the bath). The current monitored at one of the electrodes was used to identify the mixing and de-mixing status in a series of experiment cycles, with ACC precipitation highlighted as current blockage. Electron microscopy and Raman spectroscopy were used to identify ACC precipitates, while finite element method (FEM) simulations of the electrochemical mixing process enabled the supersaturation to be estimated for all reactant concentrations studied, in H2O and D2O. The work illustrated that ACC precipitation is extremely fast, and highly pH sensitive with an apparent third order dependence on carbonate concentration.
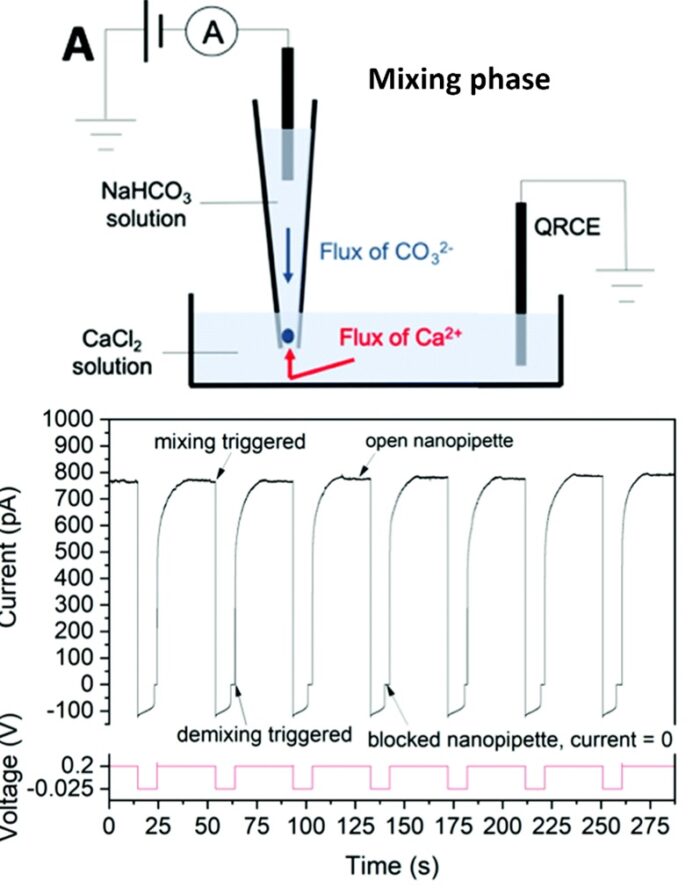
Figure 1. Top: schematic of the principles of ACC precipitate growth within a nanopipette, under mixing conditions (negative tip potential bias). Bottom: current–time trace (black) of several mixing (precipitation) and de-mixing (dissolution) cycles, along with the corresponding voltage–time trace (red). At positive tip bias, the tip is open to ion current flow; while at negative bias, precipitation of ACC occurs, represented by a distinct current transient. Reproduced from Phys. Chem. Chem. Phys. 2020, 22 (38), 22107–22115 https://doi.org/10.1039/D0CP03032E under CC-BY 3.0.
Electrochemical synthesis and analysis of metal–organic-framework (MOF) nanoparticles
Morris P. D., McPherson I. J., Edwards M. A., Kashtiban R. J., Walton R. I., and Unwin P. R., “Electric Field-Controlled Synthesis and Characterisation of Single Metal–Organic-Framework (MOF) Nanoparticles,” Angew. Chem. Int. Ed. 2020, 59 (44), 19696–19701 https://doi.org/10.1002/anie.202007146
The pipette-in-bath-solution experimental configuration was used to achieve the controlled synthesis of metal–organic-framework (MOF) nanoparticles, by mixing copper salt precursors and benzene-1,3,5-tricarboxylate ligand reagents (see Figure 2, and the Angew. Chem. Int. Ed. 2020 article). Achieving control over the size distribution of such particles is key to biomedical applications and seeding techniques. MOF crystal size and translocation frequency were captured — synchronous to the synthesis procedure — in the resistive pulses of the recorded current, while the precipitates were also characterised ex situ by electron microscopy. Complementary modelling of mass transport in the electric field, enabled particle size to be estimated, and explained the feasibility of particular reaction conditions, including inhibitory effects of excess ligand reagents. This approach should be applicable to a variety of MOFs, and scaling up synthesis may be made possible via arrays of nanoscale reaction centres, e.g., nanopore membranes.
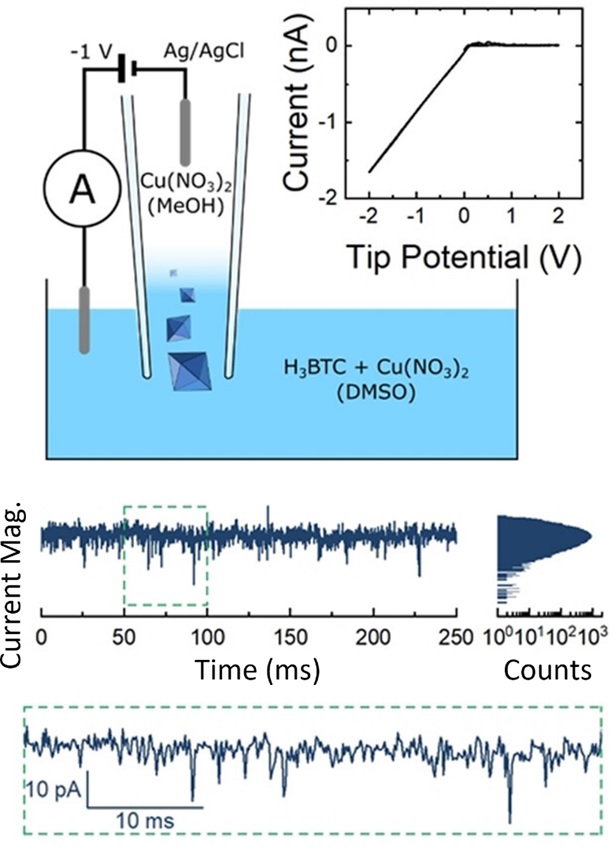
Figure 2. Top: schematic of the resistive impulse sensing setup. Inset: cyclic voltammogram obtained with H3BTC + Cu(NO3)2 in the bath and Cu(NO3)2 in the nanopipette. Bottom: example of an active region of a current–time trace at a negative tip bias. The current shows a distribution tail at lower current magnitude. Resistive impulses can vary in duration, appearing sometimes as single timepoint fluctuations (zoomed-in region). Reproduced from Angew. Chem. Int. Ed. 2020, 59 (44), 19696–19701 https://doi.org/10.1002/anie.202007146 under CC-BY 4.0.
Visualising ion fluxes in nanopipette test tubes
McPherson I. J., Brown P., Meloni G. N., and Unwin P. R., “Visualization of Ion Fluxes in Nanopipettes: Detection and Analysis of Electro-osmosis of the Second Kind,” Anal. Chem. 2021, 93 (49), 16302–16307 https://doi.org/10.1021/acs.analchem.1c02371
Nanopipettes were the object of this study, which examined the charge distribution around the pipette orifice and its effect on mass transport (see Figure 3, and the Anal. Chem. 2021 article). Placed inside an electrolyte solution bath, pipettes of tuned aperture sizes and geometries have been widely used as “test tubes”, with reactions triggered through application of an electrochemical potential between electrodes in the nanopipette and bath. Here, a laser scanning confocal microscope (LSCM) and dye solutions were utilised to track flow in nanopipette tips (20–50 nm diameter aperture), under alkaline conditions and applied potential bias of ±10 V. The experiments showed consistent flow outwards from the pipette, under either sign of potential, while FEM simulations, revealed the dominance of electro-osmotic phenomena to this end. The results highlight the significant deviation in mass transport behaviour that emerges at the nanoscale, and the utility of the combined LSCM and FEM approach in deepening understanding, which in turn should promote new applications of nanopipettes.
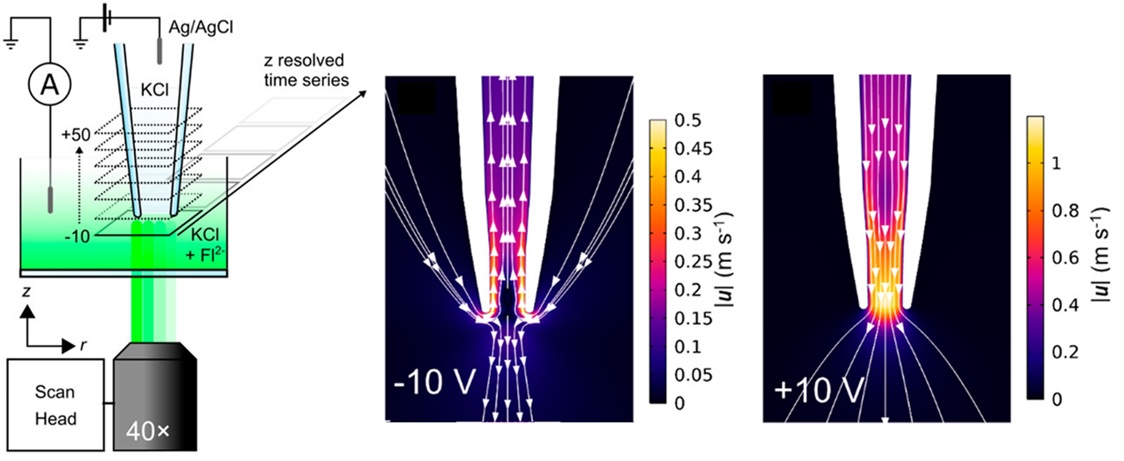
Figure 3. Left: schematic of the laser scanning confocal microscope setup used to visualise flux around the pipette orifice. Right: FEM simulation of flow velocity for the cases of −10 V and +10 V applied to the nanopipette. Reproduced from Anal. Chem. 2021, 93 (49), 16302–16307 https://doi.org/10.1021/acs.analchem.1c02371 under CC-BY 4.0.
A multi-microscopy approach to describe calcium carbonate growth
McPherson I. J., Peruffo M., and Unwin P. R., “Role of Mass Transport in the Deposition, Growth, and Transformation of Calcium Carbonate on Surfaces at High Supersaturation,” Cryst. Growth Des. 2022, 22 (8), 4721–4729 https://doi.org/10.1021/acs.cgd.1c01505
This study demonstrates how combined in situ measurements and FEM modelling can provide new insight into the relative contribution of mass transport to the growth of calcium carbonate on two model surfaces, glass and gold, under high-supersaturation conditions relevant to surface scaling. Different fluidic cells were utilised to allow coupling of, respectively, optical microscopy, quartz crystal microbalance, or IR spectroscopy, for a detailed visualisation of the target surface. The distinct in situ recordings, along with the well-defined mass transport regime, enabled a quantitative description of the growth process via initial ACC formation and eventual transformation into calcite or vaterite. FEM modelling assisted in discerning contributions from the ions in solution and also the dissolution or direct attachment of already formed ACC intermediates (see Figure 4, and the Cryst. Growth Des. 2022 article).
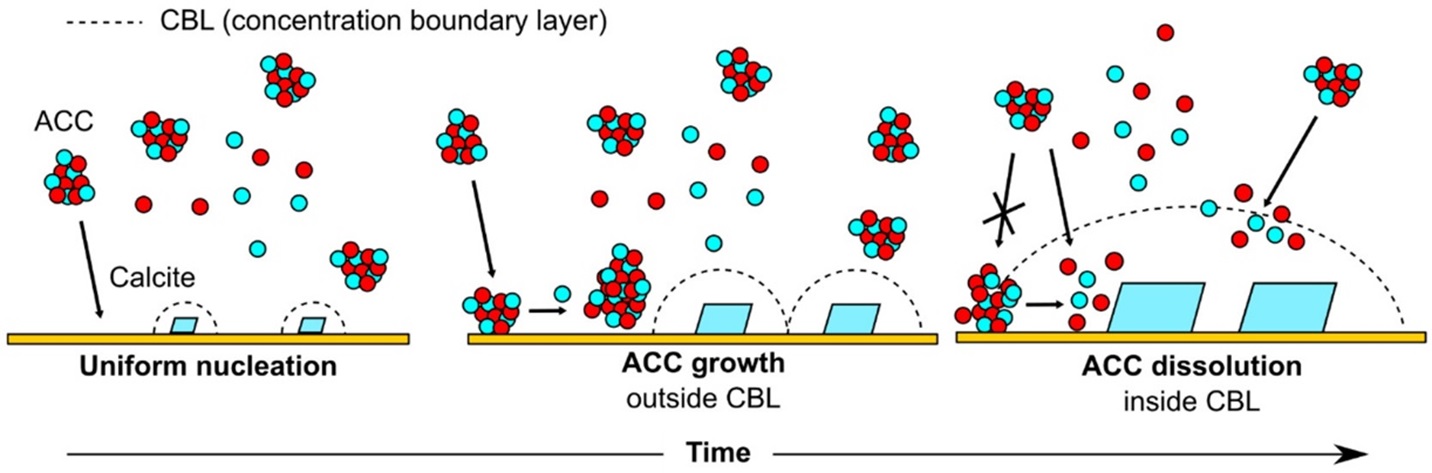
Figure 4. Schematic of calcite growth from ACC-saturated solution at three different stages in the deposition process. From left to right: (1) Formation of ACC in solution and uniform nucleation of calcite. (2) Growth of calcite, and deposition and continued aggregation of ACC, outside the concentration boundary layer (CBL). (3) Dissolution of ACC already on the surface, and of incoming aggregates, in the vicinity of calcite (inside the CBL); but continued ACC aggregation in other areas. Reproduced from Cryst. Growth Des. 2022, 22 (8), 4721–4729 https://doi.org/10.1021/acs.cgd.1c01505 under CC-BY 4.0.
Tracking electrochemically-induced phase formation on surfaces in small volumes
Valavanis D., Ciocci P., Meloni G. N., Morris P., Lemineur J.-F., McPherson I. J., Kanoufi F., and Unwin P. R., “Hybrid scanning electrochemical cell microscopy-interference reflection microscopy (SECCM-IRM): tracking phase formation on surfaces in small volumes,” Faraday Discuss. 2022, 233, 122–148 https://doi.org/10.1039/D1FD00063B
A hybrid method, combining electrochemical micro-droplet reactors with in situ optical visualisation, was used to study calcium carbonate precipitation in confinement. (see Figure 5, and the Faraday Discuss. 2022 article). Semi-transparent and conductive substrates (here, indium tin oxide-coated glass) were utilised as the working electrode, onto which small volumes of electrolyte were contained, hanging from the tip of a micropipette. A surface-sensitive, interference-based optical microscopy technique (interference reflection microscopy, IRM) enabled tracking of phase changes at the electrode–electrolyte interface, with high spatial and temporal resolution. Starting with droplet cells of acidic pH solution and driving an oxygen reduction reaction at the substrate, the dissolved calcium carbonate was forced to precipitate, as the increasing pH resulted in supersaturated conditions. The in situ optical recordings highlighted a distinctive spatial distribution of the precipitates across the working (wetted) surface, which was rationalised based on a dynamic interplay between mass transport from the pipette, reaction rates at the surface, and gas exchange at the air–droplet interface. The results were supported by FEM simulations, showing the effect of tip–substrate separation and reaction rate (applied potential bias) on shifting the local supersaturation conditions.
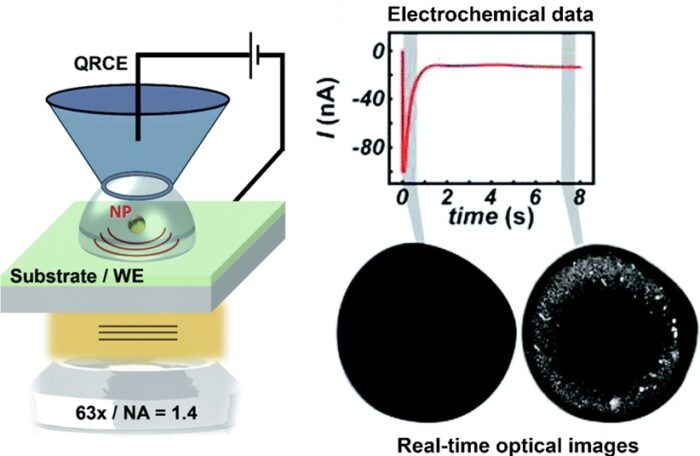
Figure 5. Left: Schematic of the SECCM-IRM setup showing (from top to bottom) the SECCM probe, droplet cell with a light-scattering nanoparticle inside, semi-transparent electrode substrate, and optical microscope. Right: Illustration of the SECCM-IRM experiment strategy, with in situ optical images revealing nanoscale features forming on the electrode surface, that would not be discernible from the electrochemical signal. Reproduced from Faraday Discuss. 2022, 233, 122–148 https://doi.org/10.1039/D1FD00063B under CC-BY 3.0.
Opto-electrochemical study of silver nanoparticle nucleation and growth within nanodroplets
Ciocci P., Valavanis D., Meloni G. N., Lemineur J.-F., Unwin P. R., and Kanoufi F., “Optical Super-Localisation of Single Nanoparticle Nucleation and Growth in Nanodroplets,” ChemElectroChem 2023, 10 (9), e202201162 https://doi.org/10.1002/celc.202201162
This work focused on describing the early stages of the nucleation and growth of metal nanoparticles inside nanodroplets (see Figure 6, and the ChemElectroChem 2023 article). Electrodeposition of metal particles on surfaces is an attractive approach to surface patterning; but also an established method in the effort to understand nucleation and growth dynamics. In situ optical microscopy has proven to be well-suited in discerning phase formation within droplet reactors, forming at the tip of a pipette reservoir when making contact with an electrode surface. Here, the hybrid opto-electrochemical technique enabled the real-time monitoring of silver nanoparticle dynamics at a confined electrode area, through synchronous monitoring, in the millisecond range, of the electrochemical and optical signatures. Image analysis routines allowed tracking the growth and movement of diffraction-limited nanoparticles, with great spatial and temporal resolution. The results strongly implicate the rapid formation, surface diffusion and aggregation of smaller entities (not detectable optically) to produce the larger deposits. The experimental platform was demonstrated across different droplet reactor sizes and is proposed for high-throughput studies with a view to survey a wide parameter space.
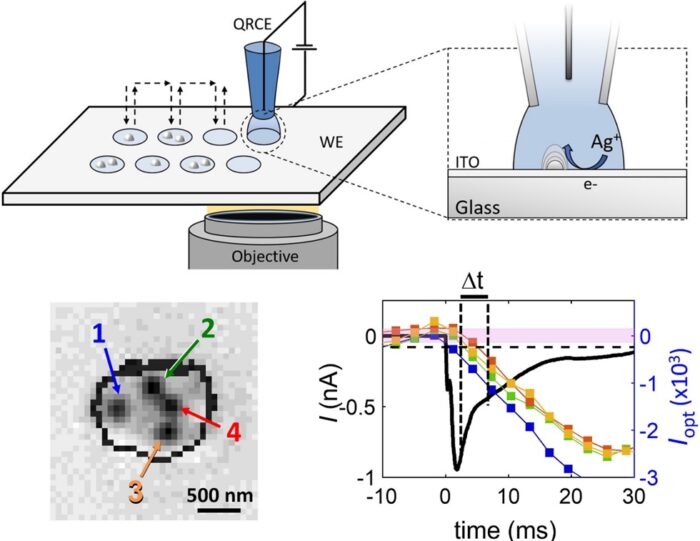
Figure 6. Top: Schematic of the SECCM-IRM experimental setup used for electrodepositing silver nanoparticles, within individual droplet electrochemical cells, while synchronously monitoring the process optically. Bottom: Processed optical image (left) of a droplet cell showing 4 nanoparticles at the end of a 0.7-second silver electrodeposition experiment. Comparison of the total electrochemical current (black line, left vertical axis) with the optical intensity traces (coloured lines, right vertical axis) for the four nanoparticles formed inside the droplet cell (right), enables tracking of reaction dynamics during the early stages of electrodeposition. Reproduced from ChemElectroChem 2023, 10 (9), e202201162 https://doi.org/10.1002/celc.202201162 under CC-BY 4.0.